


Professional charting and trading platform with portfolio backtesting, market replay, automated strategies, and EasyLanguage compatibility. Built for systematic traders who need precise control over strategy testing and execution.
MultiCharts is a professional desktop trading platform built for systematic traders. It bundles high-definition charting, a deep library of built-in indicators and strategies, portfolio-level backtesting and optimization, and automated execution into a single application. The platform connects to more than 20 data feeds and integrates with major futures brokers, giving you flexibility in how you source market data and route orders.
The product comes in two flavors: MultiCharts (regular) uses PowerLanguage, which is largely compatible with TradeStation’s EasyLanguage — existing EasyLanguage scripts run with little to no modification. MultiCharts x .NET adds C#, VB.NET, and Python development on top of the .NET framework, with full Visual Studio integration for debugging complex strategies. Both versions share the same core features; the difference is purely the programming language you use to build custom indicators and signals.
| Feature | What It Does |
|---|---|
| Portfolio Backtesting | Test a strategy across multiple instruments simultaneously with the Portfolio Trader. Run aggregated equity curves, position sizing, and risk metrics for the whole portfolio at once. |
| Strategy Optimization | Brute-force and genetic algorithm optimizers for tuning strategy parameters. Walk-forward analysis built in for testing parameter stability over time. |
| EasyLanguage Compatible | PowerLanguage runs the same EasyLanguage scripts you may already use in TradeStation. Most strategies port across with minimal changes. |
| .NET Development | MultiCharts x .NET supports C#, VB.NET, and Python with Visual Studio integration. Access external libraries, ML frameworks, and real-time debugging. |
| Market Replay | Play back historical tick data at adjustable speed for practice, training, or strategy review. Helps validate discretionary trading decisions and test execution behavior. |
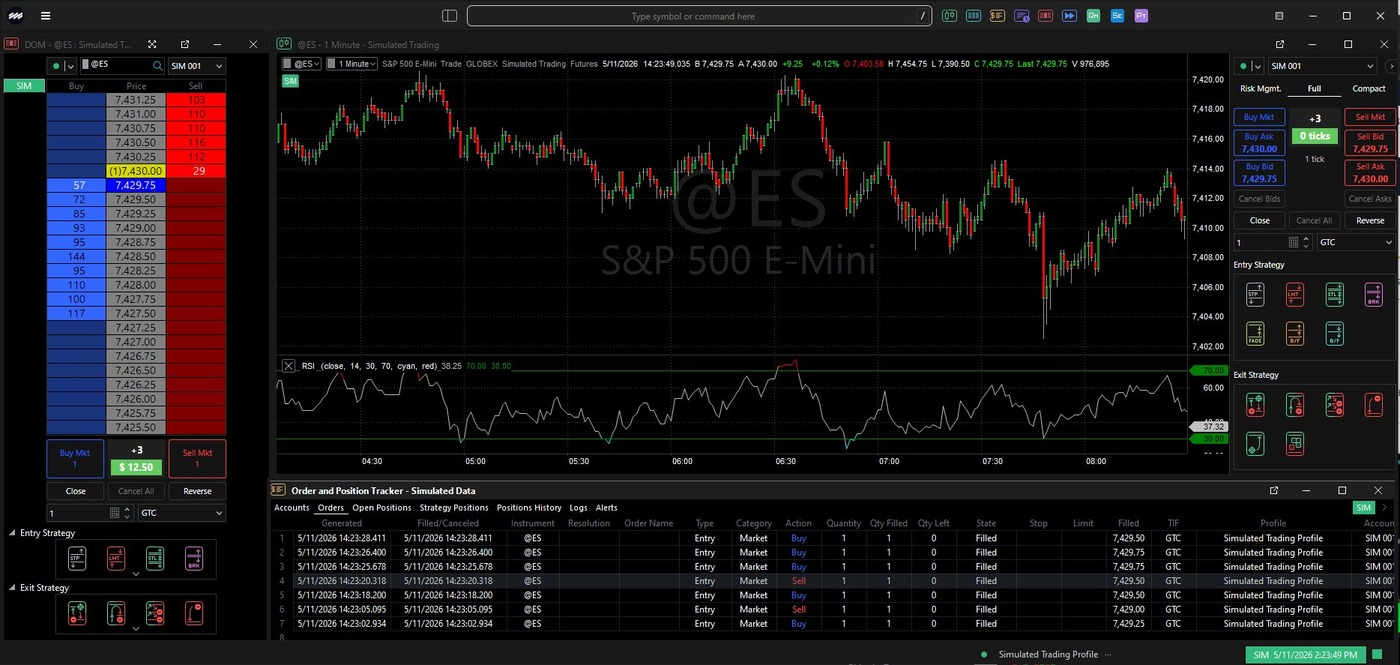
| Chart Trading & DOM | Place, modify, and cancel orders directly from the chart or DOM. View working orders and fills inline on the price axis. |
| Volume & Order Flow | Volume Profile, Volume Delta, tick-based bid/ask volume, and Level 2 market depth available across charts and DOM. |
| 20+ Data Feeds | Connect to Rithmic, CQG, Interactive Brokers, TT, and many others. Mix historical and real-time data from different sources on the same chart. |
| Order Types | Market, Limit, Stop, Stop-Limit, OCO, Trailing Stop, MOC, MOO. Day, GTC, and GTD durations supported. |
MultiCharts also includes a market scanner for monitoring lists of symbols against custom conditions, audible alerts on signal triggers or price levels, symbol mapping for cross-broker compatibility, and exporting trade logs and equity curves to Excel or CSV for further analysis.
For futures traders, MultiCharts pairs naturally with Discount Trading’s low-commission routing. Software is purchased directly from MultiCharts — we’ll help you connect the platform to your routing of choice and configure your account setup.
MultiCharts is built around a few core jobs that every systematic trader needs to do: analyze charts, test strategies, manage portfolios of those strategies, and execute live. The sections below cover each of those areas in depth.
MultiCharts ships with a full charting environment built for technical analysis. The platform handles tick, second, minute, hour, day, week, and month timeframes — plus custom intervals — with intraday data going back as far as your data feed provides.

Bar, candlestick, line, point & figure, Renko, Kagi, Heiken-Ashi, and three-line break charts are all available out of the box. Each can be switched on the fly without losing your indicator settings.
One chart window can host multiple data series at different resolutions and from different sources — overlay daily bars on a 5-minute chart, or compare two instruments on the same time axis. Useful for confirming signals across timeframes or correlating related markets.
50+ pre-built studies covering trend, momentum, volatility, volume, and oscillator categories. Drawing tools include trendlines, Fibonacci retracements and extensions, Andrews’ pitchfork, Gann tools, and free-form annotations. Custom indicators can be coded in PowerLanguage (or C#/VB.NET/Python in the .NET version) and applied alongside the built-ins.
Backtesting is one of MultiCharts’ defining strengths. The platform runs tick-precise historical simulations — meaning the backtest engine processes data the same way the live market would, tick by tick, instead of approximating from bar closes. Reports cover net profit, drawdown, win rate, average trade, profit factor, and dozens of other metrics, with equity curves, monthly returns, and trade-by-trade breakdowns.

Sweep parameter ranges exhaustively to find the combination that maximizes any target metric you choose — net profit, Sharpe ratio, profit factor, or a custom calculation. Multi-threaded execution uses all available CPU cores.
For strategies with too many parameters to brute-force in reasonable time, the genetic algorithm searches the parameter space heuristically — finding strong combinations faster than exhaustive search, with the trade-off of not guaranteeing the absolute optimum.
Tests whether optimized parameters hold up over time by repeatedly optimizing on an in-sample window and validating on a forward out-of-sample period. Helps separate genuinely robust strategies from curve-fit ones.
The Portfolio Trader runs multiple strategies across multiple instruments simultaneously, treating the whole set as a single portfolio rather than testing each strategy in isolation. Position sizing rules, capital allocation, and risk limits apply at the portfolio level — so you can model what it actually looks like to run, say, a trend-following strategy on five futures contracts with a fixed equity bankroll.
Portfolio backtests produce aggregated equity curves, combined performance metrics, and correlation analysis across the strategy-instrument grid. Live trading from the Portfolio Trader uses the same logic, so what you tested is what you deploy.
MultiCharts supports the full range of professional order types and time-in-force settings. Orders can be placed from the chart, from the DOM, or programmatically from inside a strategy script.
Market, Limit, Stop, Stop-Limit, Market-on-Close, Market-on-Open, OCO (one-cancels-other), and Trailing Stop. Time-in-force options include Day, GTC (Good Till Cancelled), and GTD (Good Till Date).
Click a price level on the chart to place an order at that price. Drag working orders to modify their price level. Right-click a fill or order marker to modify or cancel directly from the chart. Bracket orders (stop loss + profit target) can be attached to entries automatically.
Strategy scripts can fire entries and exits without manual intervention. Set audible alerts to confirm trades, or run fully unattended with conditional logic for emergency exits, position-size adjustments, and risk overrides.
For traders working off volume and order flow, MultiCharts includes Volume Profile (volume distribution by price), Volume Delta (buy vs. sell volume per bar), tick-based bid and ask volume separation, and Level 2 market depth integration. Volume Profile and Volume Delta have additional capabilities in the .NET version through scriptable access.

Both versions of MultiCharts let you build custom indicators, signals, strategies, and functions. The difference is the language.
PowerLanguage is MultiCharts’ scripting language. Its syntax and keywords are largely compatible with TradeStation’s EasyLanguage — most EasyLanguage scripts run with little to no modification, and the standard EasyLanguage code patterns you find online generally work. PowerLanguage is approachable for traders with limited programming experience; the syntax reads close to plain English.
MultiCharts x .NET swaps PowerLanguage for C#, VB.NET, or Python on the .NET framework (v4.8). The integrated PowerLanguage .NET Editor handles most needs, but the platform also pairs with Microsoft Visual Studio for full real-time debugging — step through code, set breakpoints, watch variables, and inspect exceptions. .NET scripts can call external libraries, including machine-learning frameworks like Microsoft ML, and access market data for instruments that aren’t even on the current chart.
If you already use EasyLanguage from TradeStation or want a simpler scripting language to learn, regular MultiCharts is the right choice. If you have a software-development background and want the full power of a general-purpose language — including external libraries, debuggers, and modern object-oriented patterns — MultiCharts x .NET is built for that.
The market replay engine plays back historical tick data at adjustable speed — faster than real time for quick review, slower for careful analysis. Useful for practicing discretionary entries, validating that an automated strategy reacts the way you expected, or training on specific historical conditions like a flash crash or news-driven move.
MultiCharts supports more than 20 data feeds and over 10 broker connections. For futures traders, the relevant integrations include Rithmic and CQG. Data feeds and execution can come from different providers — e.g., use one source for historical data and another for live execution — with symbol mapping to translate ticker formats across providers.
MultiCharts is purchased directly from MultiCharts. The most common license options are below; full pricing including Advanced Strategy Pack and Backtesting Edition add-ons is available on the MultiCharts site.
A 30-day free trial gives full access to the platform. A permanent Free Account is also available with the Trading Simulator for backtesting and study development on simulated data.
MultiCharts and MultiCharts x .NET are priced the same. The Advanced Strategy Pack is an optional add-on for advanced order management and execution features. Discount Trading does not resell the MultiCharts license — you purchase from MultiCharts directly, and our team helps configure your routing and account setup so the platform connects cleanly to your live trading account.
Same trading platform underneath — same charting, backtesting, order management, and feature set. The difference is the programming language for building custom indicators and strategies. MultiCharts (regular) uses PowerLanguage, which is largely compatible with TradeStation’s EasyLanguage and easier to learn if you’re newer to programming. MultiCharts x .NET uses C#, VB.NET, or Python through the .NET framework, with Visual Studio integration for serious debugging and external library access. Discount Trading supports both — pick the one that matches your programming background.
No. MultiCharts ships with 50+ built-in indicators and a library of pre-coded strategies you can apply, configure, and backtest without writing a line of code. Programming becomes useful when you want to build custom indicators or automated strategies of your own design. Many MultiCharts users start with the built-ins and grow into PowerLanguage over time, often by modifying existing strategies rather than writing from scratch.
Most of them, yes. PowerLanguage and EasyLanguage share the same syntax and most of the keywords, so straightforward EasyLanguage scripts often run in MultiCharts with no modification. More complex scripts — especially ones using TradeStation’s object-oriented features — may need adjustment. If you’re migrating a strategy library, we recommend starting with the 30-day free trial to confirm your specific scripts port cleanly before committing to a license.
Not natively — MultiCharts is Windows-only software. Mac users typically run it through a Windows virtual machine (Parallels, VMware Fusion) or a Windows VPS. For serious systematic trading, a Windows VPS is often the better setup anyway — it keeps the platform running 24/6 without depending on your local machine staying online.
Yes, two ways to use MultiCharts at no cost. The 30-day free trial gives full access to the paid platform — you do need to enter a payment method but can cancel within the window. The permanent Free Account doesn’t expire and lets you use the Trading Simulator with simulated data for backtesting, strategy development, and study creation. The Free Account is genuinely useful for learning the platform or developing strategies before going live.
Rithmic and CQG — the two routing options we support. Both have direct integration with MultiCharts, so once your live account is set up, you can plug MultiCharts into either feed for real-time data and live execution. We’ll help configure the connection during account setup. If you’re using MultiCharts with a different data feed for backtesting only, that’s also supported and doesn’t require any setup on our side.
No — we don’t resell or discount MultiCharts licenses. You purchase directly from MultiCharts at their standard pricing. Where Discount Trading adds value is on the trading side: low commission routing, account setup help, platform configuration support, and 24/6 trade desk access once you’re live. Combining a one-time MultiCharts lifetime license with our low commission structure tends to be more cost-effective long-term than brokers that bundle a “free” platform with higher per-contract fees.
Fill out the form below to start a free MultiCharts demo. Our team will follow up to help with platform installation, data feed setup, and routing configuration for live trading through your Discount Trading account.

