


Cloud-based trading and charting software. MarketDelta invented the Footprint® Chart — a multi-dimensional display that combines price, volume, and delta into a single bar so you can see who’s being aggressive at every price level.
The original Footprint chart from the firm that pioneered the format — shows bid/ask volume traded at every price level inside each bar.
Runs in any modern browser. No local installation, no version mismatches, and your full workspace follows you across machines.
Built-in session, composite, and TPO volume profile overlays for spotting value areas, POC migration, and high-volume nodes.
Cumulative delta, delta divergence, and footprint delta filtering to read aggressor side and order flow imbalance.
Synchronize crosshairs and selections across multiple chart windows for cross-timeframe analysis on the same instrument.
Replay historical sessions tick-by-tick at adjustable speed, including the full footprint and volume profile data.
Save and load chart layouts, drawing tools, indicator combinations, and instrument lists across sessions and devices.
Access from any computer with a modern browser, plus mobile chart viewing for monitoring positions and key levels on the go.
MarketDelta is a leader in trading and charting software. MarketDelta invented the Footprint® Chart, which helps traders execute better.
Cloud based trading and charting software.
Technical analysis with a special focus on Volume Profile, TPO Profile and tools for reading Order Flow.
Log in and trade anywhere.
Server-side OCO’s and bracket orders.
Trade from charts, DOM, trade ticket.
Direct connect, low-latency futures trading platform.
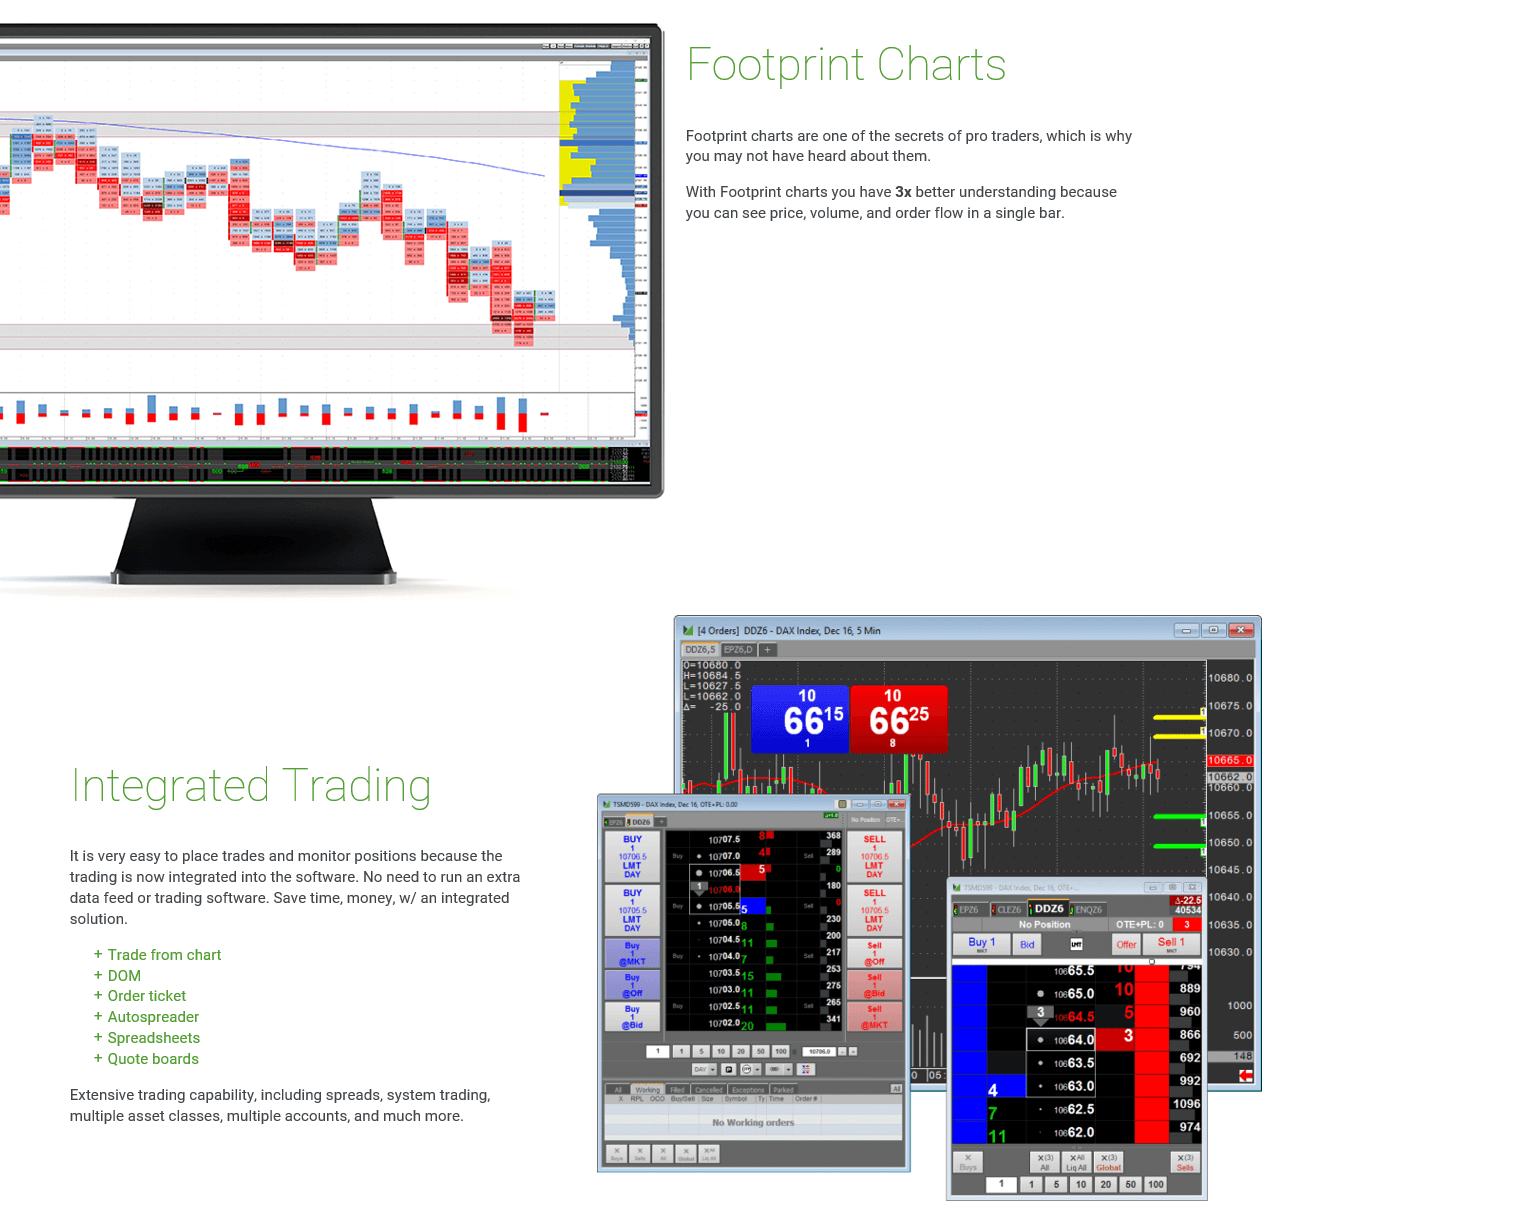
The Footprint® Profile will clearly show which prices are experiencing more volume through the shape of the bar and show who is being more aggressive by using color at each price. The color is associated with the delta (net buying/selling) at each price.
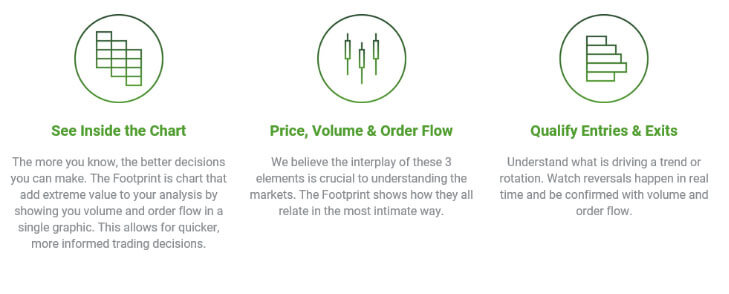
Understand where high and low volume is occurring and if the aggressive buyers or aggressive sellers are in control. Tracks volume with price to produce a multi-dimensional display for quicker identification of changes in the underlying market.
The primary characteristic of the Footprint® is to provide greater detail of underlying market dynamics. View Footprint® Profiles in any time frame you choose — short or long term.
By knowing where a majority of volume is trading within the bar, it is clear where other traders are finding value and executing trades. Follow and better understand order flow to the bid and ask.
Volume is crucial in determining price strength at every price level, but especially at potential support & resistance and other turning points in the market. This chart will provide the best possible way of gauging these points in a short term time frame. When the markets are noisy and range bound, this chart will reflect it by having normally distributed bars.
Combining price with total volume and bid/ask volume creates unprecedented accuracy for short-term price rotations. Multiple chart types — time, tick count, volume bars, range bars, change bars, tick reversal (point & figure) — are all available. Time your entries and exits with much greater precision.
Allow volume and directional order flow to provide clues to price direction. Tracks volume with price to produce a multi-dimensional display for better interpretation of underlying market dynamics. Momentum is a direct result of price activity, which leads to creation of volume.
Add a Volume Breakdown Indicator to the bottom of the chart to plot delta and keep a pulse on the underlying strength of each bar. This is a great method for observing market psychology in real time. Each Footprint combines price, volume, and delta to act as a thermometer of price strength and then alerts through color and shape.
MarketDelta is embracing and driving the cloud trading revolution. They see the cloud as a critical way to deliver cost efficiency, increase market access, and ease of use for both brokers and traders.
The MarketDelta Cloud liberates users by allowing them to trade in an enriched environment that gets richer each day as incremental updates are automatically available with each login. 100% of the SAAS platform is available directly through the browser on any device.
MarketDelta brings knowledge and expertise. They see themselves solely as a SAAS software company whose job is to build and deliver the best possible products for traders.
Several other platforms supported by Discount Trading offer footprint charts and order flow analysis. Each takes a slightly different approach to visualizing volume and delta at each price level:
Not sure which platform fits your trading style? Contact a Discount Trading representative and we’ll help you compare.
Send us your details and a Discount Trading representative will be in touch. Your personal information is kept confidential and is not sold to other companies.
MarketDelta invented the Footprint chart. The cloud platform brings the same analytical depth that institutional trading desks have used for two decades into a modern browser environment.
Cloud-based means no Windows-only installer, no driver conflicts, no version updates. Log in from any computer with a browser and your full workspace is right there.
Discount Trading provides the Rithmic routing that underpins MarketDelta Cloud, giving you tick-by-tick data integrity and a smooth onboarding from account opening to your first live trade.
Footprint charts and volume profile setups have a lot of dials. We help clients get their initial layout configured for the contracts they actually trade so the platform is useful on day one.
MarketDelta is cloud-based, so if your internet drops or something looks wrong on the platform, our trade desk can place or pull the order for you over the phone. Coverage runs through U.S. and overnight Globex sessions.
MarketDelta is a specialist platform: footprint, volume profile, delta, and aggressor analysis are the focus. We support clients who pick this kind of tool over a generalist charting package.

