
+1-219-769-0366
1-800-747-1420
1-800-747-1420


Disclaimer: This third-party trading platform demo is designed as an introduction to the platform and its functionality. It is not intended to mimic trading results in a live trading environment. In an actual live trading environment, commissions and fees would be applied at the close of every business day, and an account statement would be generated. Daily statements and the associated fees are not applied within the demo environment and as such, those fees, which may have a material impact on your account, are not reflected in final profit and loss calculations within this demo. Other factors such as latency fill price and execution times may also differ from live trading results. It is not intended for this demo to be an accurate representation of actual profits or losses that may occur in a live trading environment. These 3rd party platforms generally supply the user with real-time market data, however that can change at any time and without notice. This data should not be considered an adequate approximation of the trading results or experience that may occur in a live-trading environment.

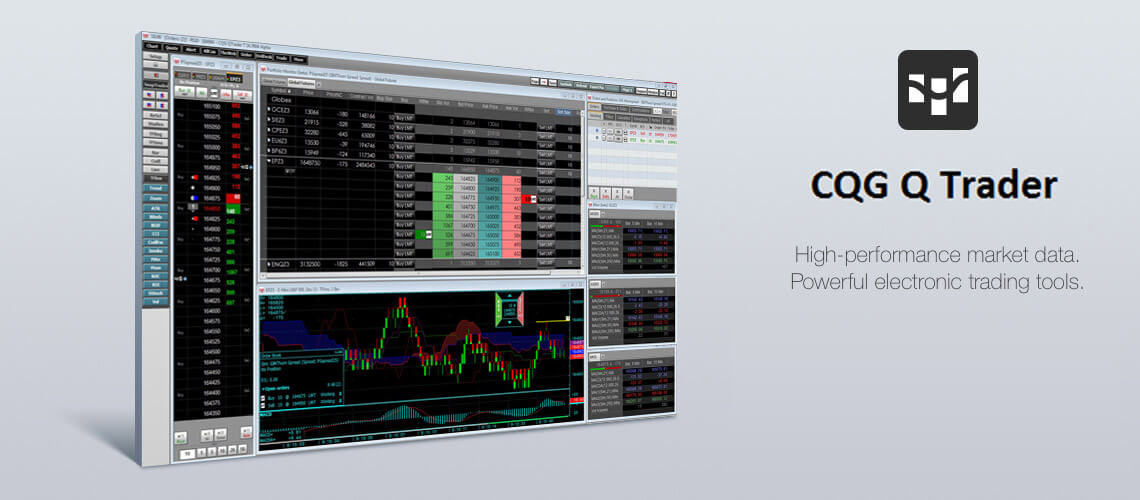
For more than thirty years, CQG has developed new technologies, offering real-time and historical data integrated with technical analysis tools. Our innovations have become industry standards. CQG lead the industry in providing reliable market data, superior decision making tools, and order execution software with customer support that understands the trader.
The recently released Q Trader cleverly bridges the gap between the trader and Integrated platform by offering charts and increased functionality without making the price too prohibitive to the average trader.
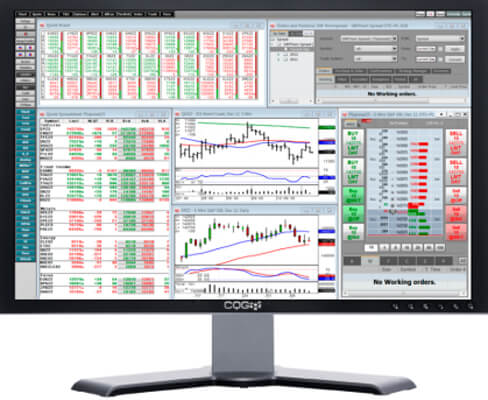
The professional trader's go-to platform, CQG QTrader includes analytics, charts, and multiple trade execution interfaces in one comprehensive solution. CQG QTrader offers many of the same features available in our flagship product, CQG Integrated Client.
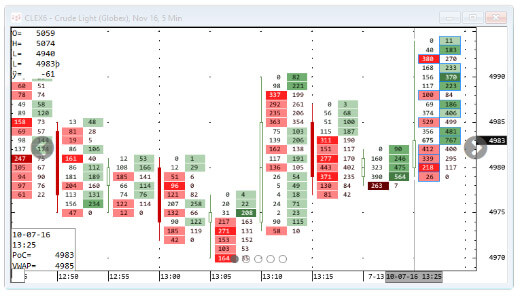
CQG has integrated Footprint® Charts and Studies into CQG Integrated Client and CQG QTrader, allowing customers to view the popular Footprint chart. The primary focus of this chart type is to organize and display the volume traded at each price and provide an indication of its impact on price. Five variations of the Footprint chart are available:
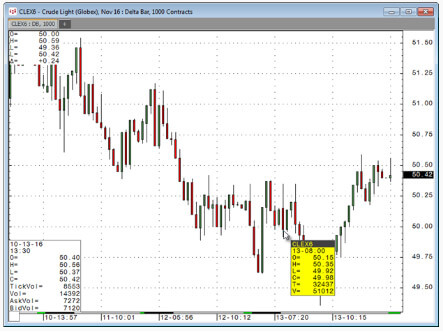
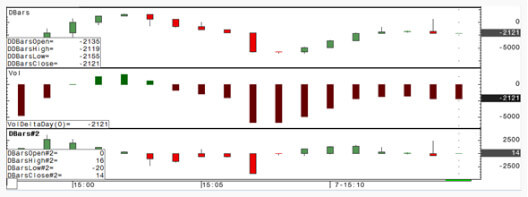
The Delta Bar chart is a non-timed bar chart with the Delta Bars study applied automatically.
Delta is the difference between buys and sells. A Delta Bar is constructed based on the Delta Level. For example, if Delta Level is set to 100, a new bar is started when delta reaches +/- 100.
Bars are colored based on the direction of trading. Using default colors, the candle is green when up and red when down.
Delta Level, colors, and line display (candle) can be changed using parameters. Volume type can also be changed.
The setup of this chart is ideal if you typically employ bar charts in your market monitoring and analysis.
The Footprint chart type is based on a bar chart and displays cells of order flow data for each bar. You can also apply the study to other chart types.
The footprint adds – in the format of a volume profile – order flow context to the market in an effort to improve timeliness.
Choose from five footprint styles. These styles are detailed in parameters.
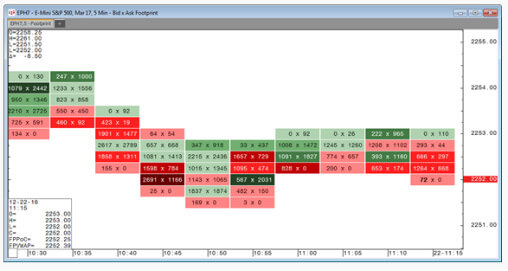
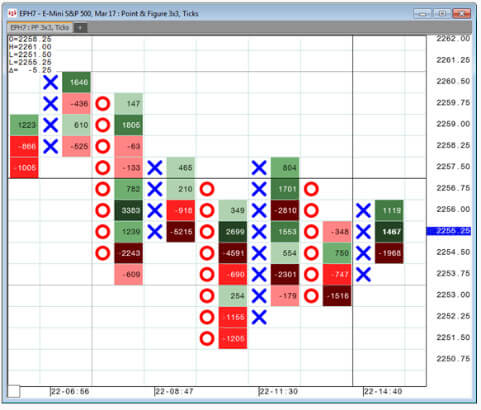
This image shows the Footprint chart with Style = Bid x Ask.
This study is used with the Footprint chart and Footprint Indicator and is the basis for the Delta Bar chart.
Delta is the difference between buys and sells. A Delta Bar is constructed based on the Delta Level. For example, if Delta Level is set to 100, a new bar is started when delta reaches +/- 100.
Delta Bars, displayed as candles, are colored based on bids and asks. Using default colors, the candle is green when there are more asks and red when there are more bids.
Alternatively, you can turn on the Accumulate parameter to plot the OHLC of delta, where the bar starts not at zero but where the previous bar closed. This essentially creates a candlestick chart of delta. See Outputs for definitions of these values.
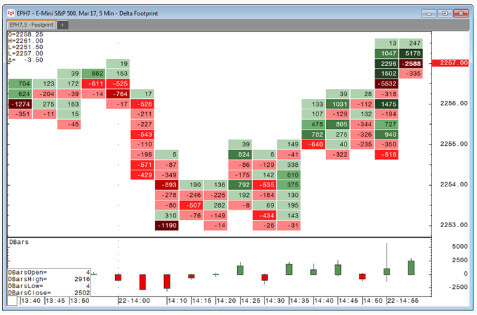
This image shows the Footprint chart with the Delta Bars study at the bottom of the chart. Change the colors for this study in parameters.
Displayed in the cursor value box when Accumulate parameter is off:
Displayed in the cursor value box when Accumulate parameter is on:
DDBars are composed of Delta Day Volume (Volume Study, Highlight Delta Day) outputs and DBars outputs.
(FPBS) Footprint Bar Statistic
This study is used with Footprint charts and the Footprint Indicator and is helpful if you want to expose the information behind the bar.
The FPBS study is added as a table to the bottom of the Footprint chart window.
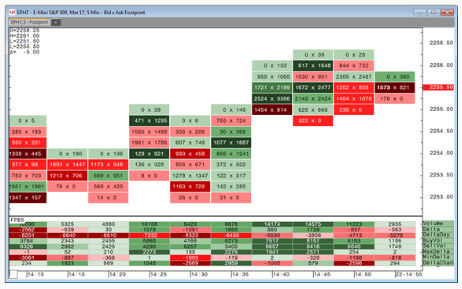
This study adds order flow context to the market in an effort to improve timeliness.
When you add this study to a bar chart, cells with order flow data are placed to the right of the bar. To see only these order flow cells, use the Footprint chart, a bar chart with this study applied automatically and the bars hidden.
Use this indicator with these chart types: Bar (1-min to daily), Candlestick (1-min to daily), Line (1-min to daily), No Gap (1-min to daily), CVB, Delta Bar, Sub-Minute Bar, Range, Renko, Point and Figure, Heikin-Ashi, Time-Based TFlow, and Mark Fisher.
Combining the footprint with point and figure, for example, adds sophistication to that chart type, allowing traders to dig deeper in the data. Range bar charts and candlestick charts are also good choices.
CQG offers twenty chart types
To quickly select and move between chart types, add chart type buttons to the chart toolbar using tool manager.
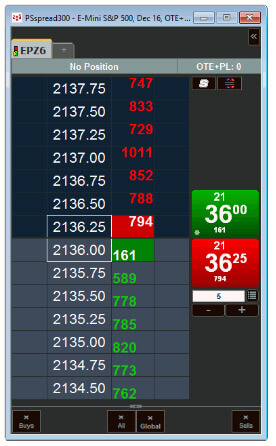
Hybrid Order Ticket is our newest order-entry method that incorporates components of other order-entry screens, including DOMTrader and Order Ticket. You can keep the display clean or add more functions to maximize your trading style.
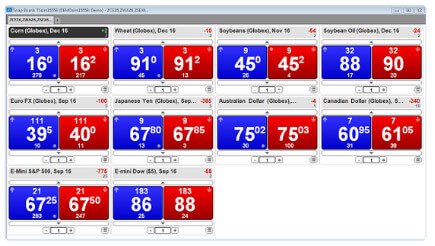
Split Quote Board is a new view for quotes that offers a user-friendly snapshot of the quotes you want to monitor. Quotes have never been bolder. Not only can you easily set up and monitor quotes, you can also trade directly from Split Quote Board.
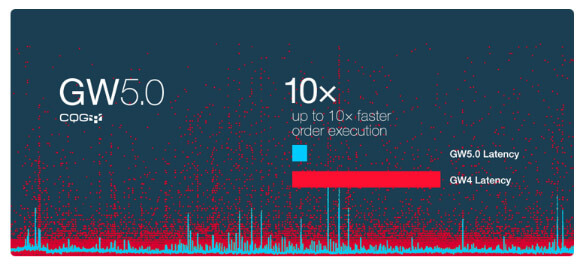
With Gateway 5.0, our next generation, low-latency order routing system, we've added microsecond routing to our ever-expanding list of counterparties.
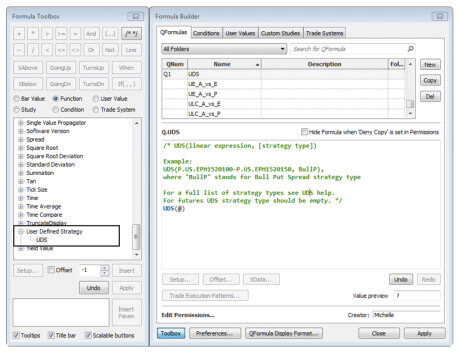
UDS and options analytics continue to get more robust with CQG. We're constantly working to include more of what you need to support your trading. We've enhanced UDS to include both time and sales and real-time data for UDS expressions.
| Recommended Minimum | |
|---|---|
| Processor | Intel Core i5 or i7 |
| Operating System | Windows® 7 |
| Memory | 2GB RAM |
| Hard Drive | 7200RPM 500GB SATA 6.0 Gbit/s HDD with 4GB free hard drive space |
| Video Card | 128MB of memory (128 MB per video card if multi-monitor) |
| System Setting | Hibernate and stand by modes cannot be used on a system running CQG Trader. |
| Recommended Minimum | |
| Specifications | Hard drive power-saving features should also be disabled. |
| Internet Access | CQG Trader requires Internet service via a high-speed connection, such as DSL, cable, or fixed wireless/wireless local loop (WLL). Wireless Internet connections are not recommended, especially broadband over a WiFi card. Dial-up is not supported. All network communications between CQG customers and servers are initiated from the client side. The destination port number at the server side is 2823, CQG's registered port number. CQG also uses a secure connection, port number 443, for authorization purposes. |
| Monitor Setups | These specifications are appropriate for single- and dual-monitor setups. If you have three or four monitors, you will need a higher performance processor, video card, and network connection. |

