


Bookmap turns the limit order book into a live heatmap. Watch liquidity stack, pull, and shift in real time across futures, stocks, and crypto — from a desktop app or a web browser. Trade what you can actually see.
Most charting platforms show you price. Bookmap shows you the order book. The signature heatmap plots every resting bid and offer at every level over time, colored by size, so you can see where liquidity is real, where it gets pulled, and where the market actually trades through.
Bookmap has been around since 2012, originally built by traders who wanted a better way to read the depth of market than a flickering DOM ladder. It runs at 40 frames per second by default and can be pushed to 125 FPS. The replay engine records every tick and update so you can step back through a session and study what happened down to the millisecond.
The platform covers futures (CME, CBOT, NYMEX, COMEX through MBO data), stocks via Nasdaq TotalView, and crypto across more than 20 exchanges. Same heatmap, same workflow, three asset classes.
Bookmap connects to your Discount Trading account through Rithmic or CQG routing. Setup is straightforward once you know which add-ons you actually need and which data feed fits your trading. We handle that with you when you set up the account, so you are not paying for tools you will not touch.
The Digital tier is free and useful for getting familiar with the heatmap on delayed data. To trade live futures you need at minimum the Global plan, which runs $49 per month or $39 per month annual. Most active traders end up on Global+ once they start using the Stops & Icebergs and Large Lot Tracker add-ons.
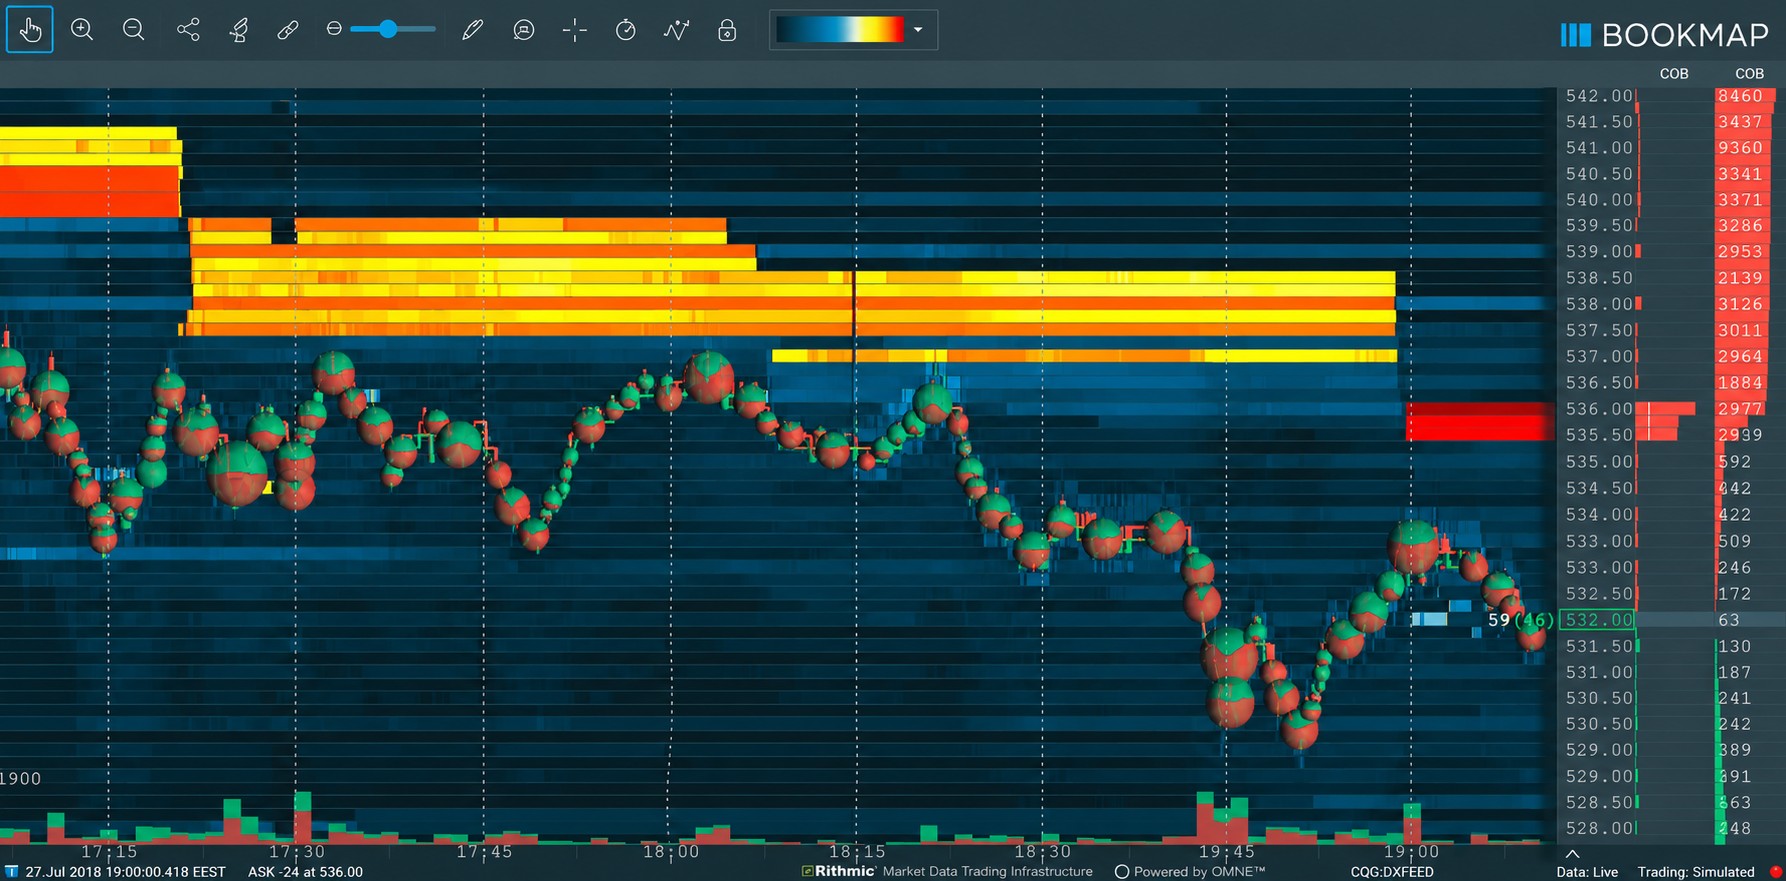
Historical order book plotted as a heatmap. See where size is sitting, where it stays, and where it disappears before price moves.
Color-coded trade markers and per-price volume bars overlay directly on the heatmap to show real executions in context.
Add-on that flags hidden orders the moment they get hit, exposing size that does not show in the visible book.
Filters out small retail flow and highlights only the trades that matter, so you can follow size instead of noise.
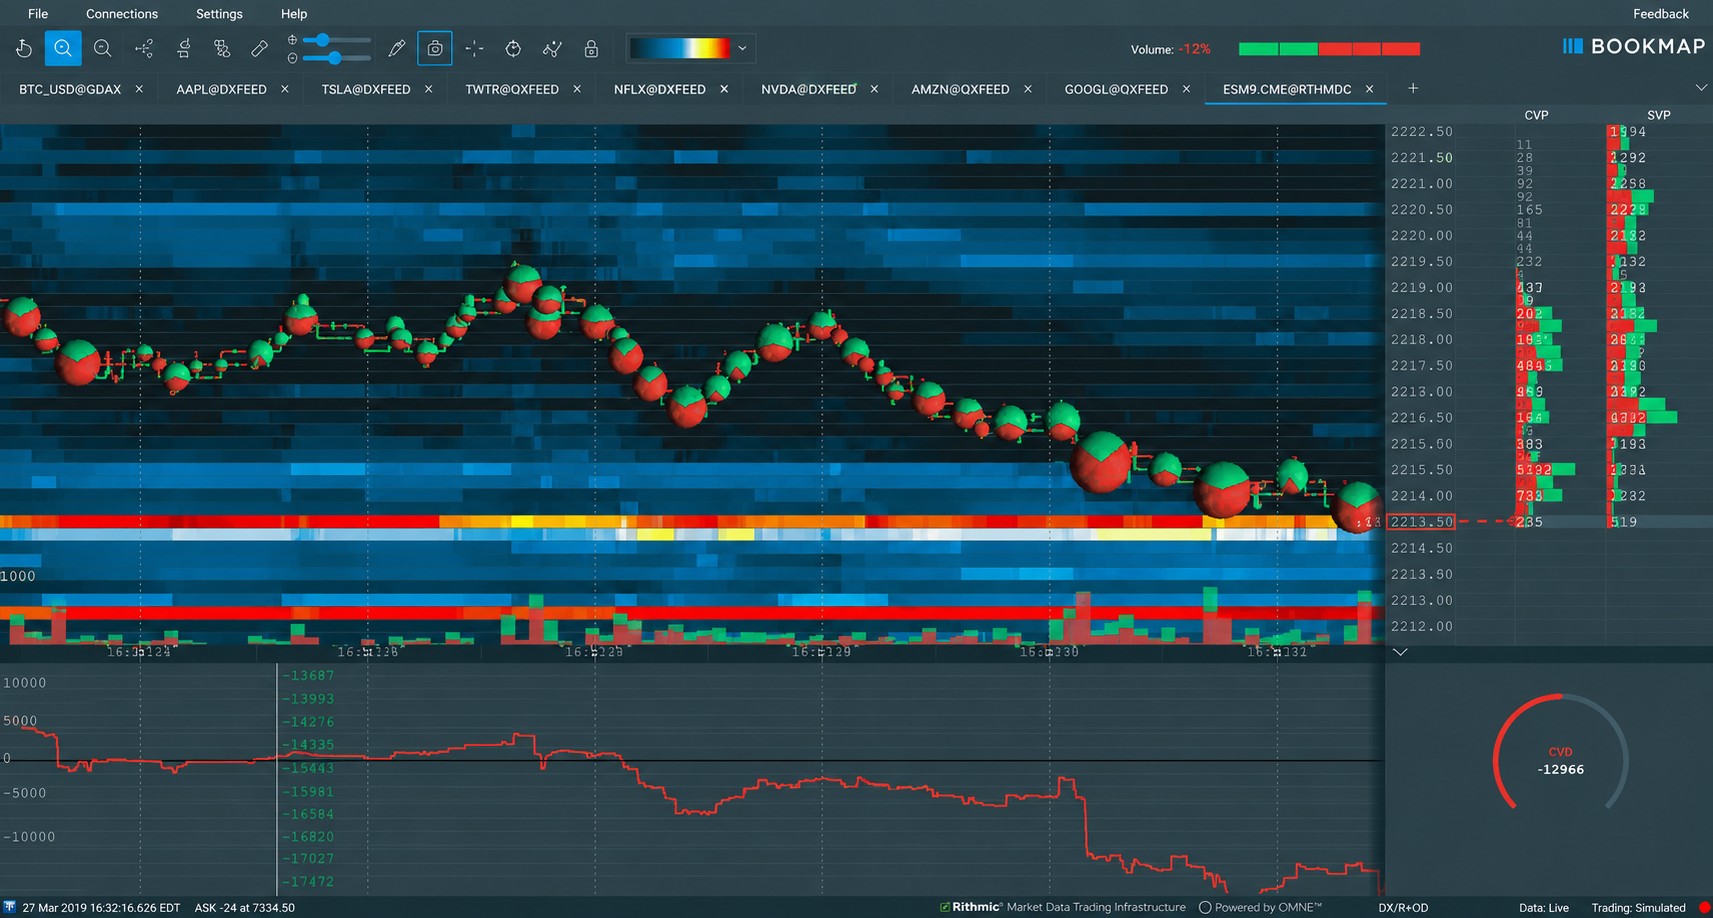
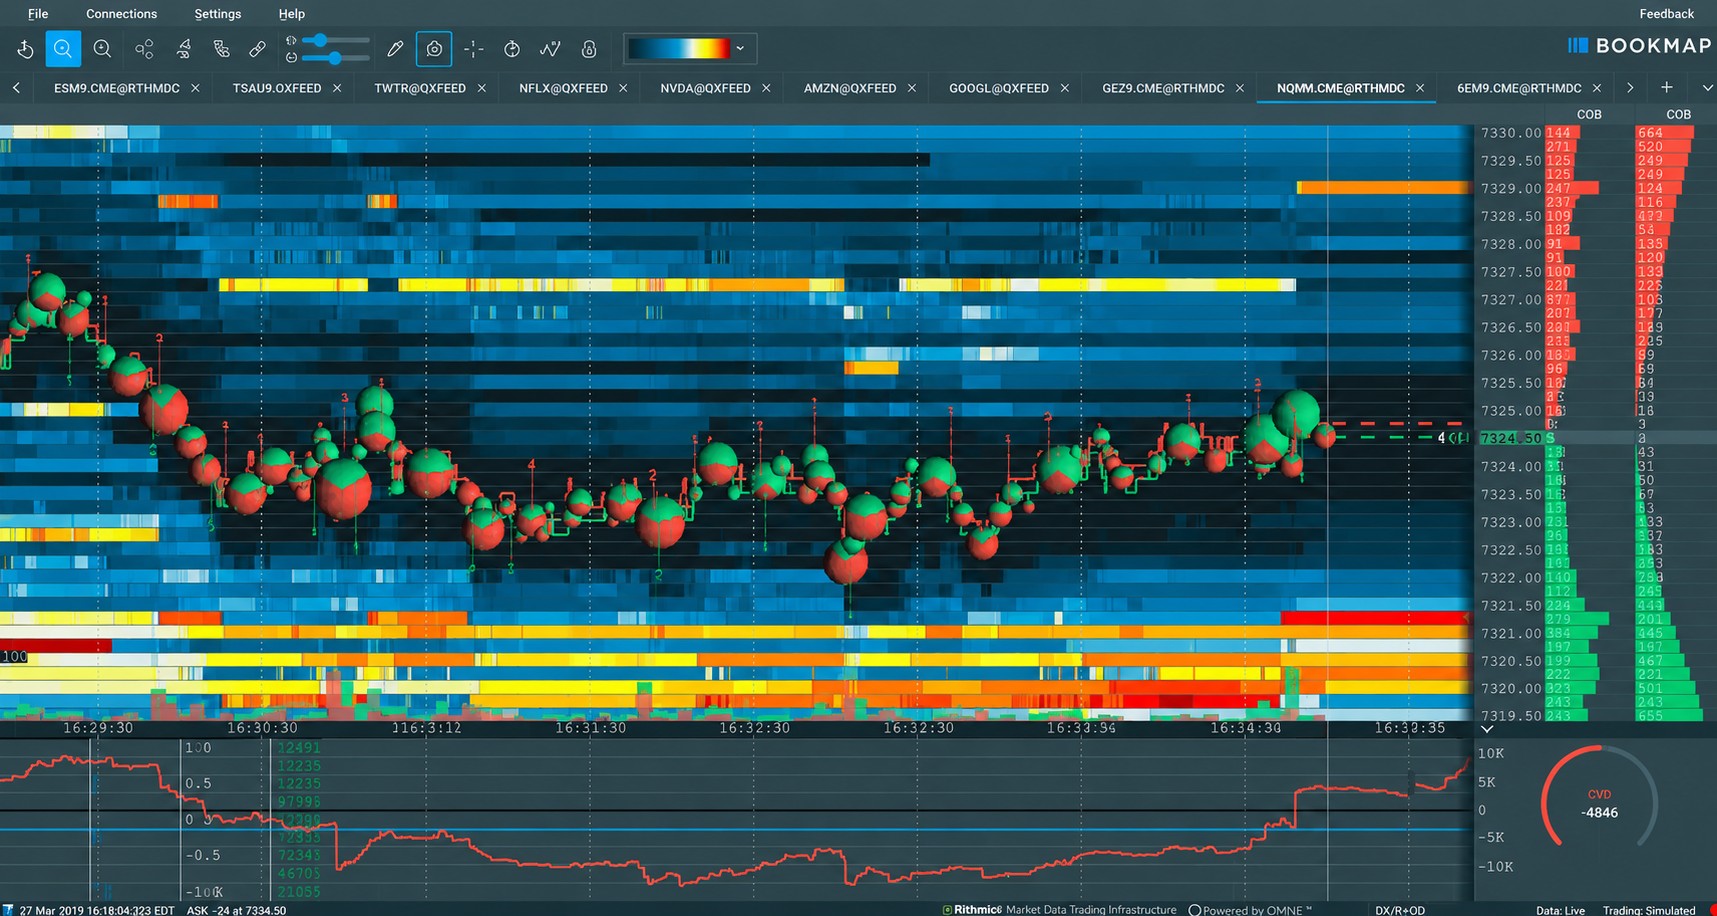
Watch up to 20+ symbols at once with synchronized heatmaps. Useful for spread traders and anyone monitoring correlated markets.
Every tick is recorded. Step back through a session bar by bar to study what actually happened, at any speed you want.
This is what makes Bookmap Bookmap. A traditional DOM ladder shows you a snapshot of resting orders right now. The heatmap shows you that same data through time — every order added, every cancellation, every fill, colored by size.
Brighter yellow and white areas mean heavy resting size. Dimmer areas mean thin book. As price moves, you can see liquidity stacking ahead of it, getting pulled before it arrives, or absorbing aggressive flow without budging. That tells you something a candlestick chart cannot.
Bookmap is available two ways. The desktop app is the full-featured version — runs on Windows, Mac, or Linux, supports every add-on, and works with replay files. The web platform runs in any modern browser. No install, no driver headaches, and your layout follows you to any machine.
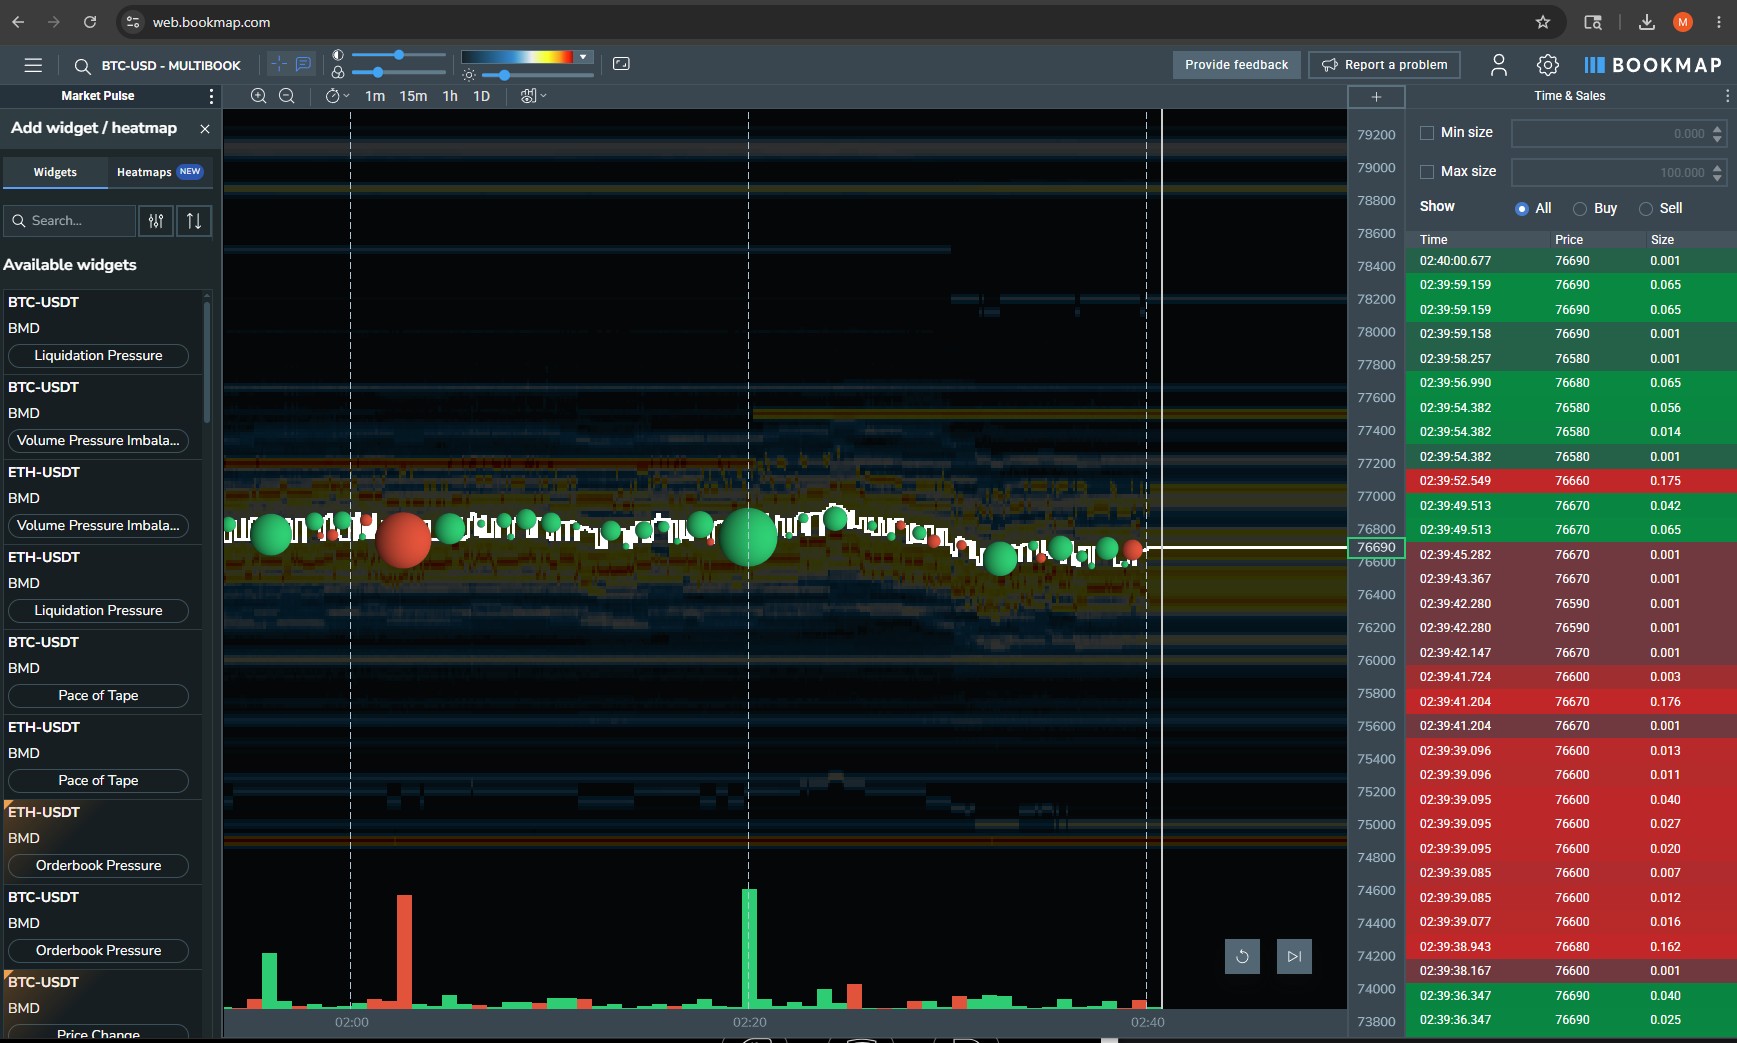
Most traders pick one and stay there, but you can run both with the same account. The web version is the newer of the two and the simpler way to evaluate Bookmap if you have not used it before.
The heatmap shows resting orders. Volume tools show what actually executes. Bookmap layers volume markers directly on the heatmap so you can see prints and pending size on the same chart.
Two of the more useful paid add-ons. Both deal with the same problem: not every order is visible on the book, and not every trade matters.
An iceberg order shows a small visible size on the book but has much larger hidden quantity behind it. Standard charts miss icebergs entirely. The Iceberg Detector flags them the moment they get hit, marking the price level and estimating the hidden size. That tells you where a serious participant is defending a level and where pulling that level might actually move price.
The Large Lot Tracker filters out the constant churn of small orders and highlights only trades above a threshold you set. The result is a much cleaner picture of who is actually moving the market — not a feed of noise. Useful for traders who want to follow size rather than react to retail flow.
Both add-ons are included in the Global+ package or available individually as marketplace subscriptions.
Two power features that get heavy use once you are past the learning curve.
Run up to 20+ symbols simultaneously with linked heatmaps. Spread traders use it to watch both legs at once. Index traders watch ES, NQ, YM, and the futures complex side by side. You can synchronize cursors and timeframes across windows or run each independently.
Build a synthetic instrument from one or more legs — useful for spreads, ratios, and combinations that do not exist as a single contract. The synthetic shows up in the heatmap like any other instrument.
Bookmap records every tick of order book activity by default. Replay any session at any speed, scrub through it like video, or step bar by bar. The most useful tool for reviewing what went right or wrong after a session ends, and for rehearsing setups before the open.
Bookmap connects to your futures account through a data feed and routing gateway. With a Discount Trading account, two paths work well.
The most common Bookmap setup. Low-latency data and execution, supported as a first-class connection in Bookmap. Works on both desktop and web. We help configure the Rithmic login and routing during account setup.
CQG also works with Bookmap for both data and execution. A good fit if you already have CQG running for other tools or if you prefer CQG’s data quality and routing characteristics.
For visualization only, Bookmap sells its own data subscription with MBO (Market by Order) granularity for CME futures. Useful as an analytical layer alongside your Discount Trading execution routing.
Through Rithmic or CQG you get CME, CBOT, NYMEX, COMEX, and ICE futures. Bookmap also covers Nasdaq stocks via Nasdaq TotalView and 20+ crypto exchanges, though those run through Bookmap directly rather than through your futures routing.
Bookmap uses a tiered subscription model. Annual billing knocks 20% off monthly prices. Market data fees from Rithmic, dxFeed, or CME are charged separately.
Crypto live, futures & stocks delayed
Adds basic indicators & alerts
Live futures & stocks data, full heatmap
Adds Stops & Icebergs, LLT, premium add-ons
Pricing reflects monthly billing. Annual billing reduces these by approximately 20%. Exchange fees apply separately.
Discount Trading clients get an exclusive offer on Bookmap. Request a free trial and we’ll get you set up with the offer along with your Rithmic or CQG routing.
Request Your Bookmap TrialYes. Bookmap Web is a browser-based version that runs without an install and works on any modern desktop browser. The desktop app is still available for traders who want full add-on support and offline replay.
For live futures and stocks data you need a market data subscription. Bookmap connects to Rithmic, CQG, dxFeed, and direct BookmapData feeds. CME exchange fees are charged on top of the platform subscription. Crypto data is included in all plans, including the free Digital tier.
You need at minimum the Global plan at $49 per month (or $39 per month on an annual subscription) to access real-time futures data through Rithmic or dxFeed. The Digital free plan only offers delayed futures data and is meant for evaluation.
A liquidity heatmap is a visualization of historical limit order book data. Each price level is colored by the size of resting orders at that level over time. Brighter colors mean more orders. The result is a picture of where the market trusts price to react, rather than a candlestick showing only what already happened.
The Large Lot Tracker (LLT) is a Bookmap add-on that highlights significant trades and identifies dominant participants in real time. It helps you see when institutional-size orders are working, separate from the noise of small retail flow.
Bookmap connects to your Discount Trading account through Rithmic. We help you set up the Rithmic credentials on the Bookmap side, configure the routing, and walk through the first connection. If you want CQG routing instead, that also works with Bookmap.
Yes. Bookmap covers futures, stocks (via Nasdaq TotalView), and crypto on more than 20 exchanges. The same heatmap and order flow tools work across all three asset classes.
Bookmap offers a free Digital tier with real-time crypto data and delayed futures and stocks data. You can use it indefinitely as an evaluation. For live futures, the Global plan is the entry point at $49 per month.
Tell us a bit about yourself and we will reach out to get your Bookmap setup configured, walk through Rithmic or CQG routing, and answer any questions about which plan fits your trading.
Disclaimer: This third-party trading platform free trial is intended as an introduction to the platform and its functionality. It is not designed to mimic results in a live trading environment. In an actual live trading environment, commissions and fees would be applied at the close of every business day. Latency, fill price, and execution times may also differ from live trading. These third-party platforms generally supply real-time market data, however that can change at any time. This data should not be considered an adequate approximation of trading results or experience that may occur in a live-trading environment.
Bookmap is the platform that turned order book visualization into a heatmap. Pair it with Discount Trading low commissions and you have a serious order flow setup at sensible cost.
Run Bookmap as a full desktop install for power-user workflows, or jump into the web version from any computer. Both connect to your Discount Trading account.
Same heatmap workflow across CME futures, Nasdaq stocks, and crypto. Useful if you trade more than one market or just want consistency in how you read the book.
Our trade desk is reachable 24 hours a day, 6 days a week — covering U.S. regular hours and globex/overnight sessions when global markets are most active.
Discount Trading has worked with futures traders since 1997. We have set up routing for hundreds of Bookmap users and know the quirks of getting Rithmic and CQG connected cleanly.
Try Bookmap risk-free on the Digital plan with real-time crypto and delayed futures. When you are ready to trade live, the Global plan is the entry point.

